 |

|
| EPoS Contribution |
|
Where are the commonly used "dense gas" molecular line tracers really emitting within star-forming regions?
Ashley Barnes AIfA, Bonn, DE | |
| The current generation of high-sensitivity (sub)mm-telescopes have allowed the emission from many molecular lines to become a major tool for studying the physical properties of both galactic and extragalactic star-forming systems. However, we need to develop a detailed understanding of molecular chemistry and excitation across a range of environments before we can fully exploit molecular line emission data to its full potential. With this in mind, the IRAM-30m large project "Line Emission to assess Galaxy Observations" (LEGO) aims at developing a comprehensive picture of how 3mm-band emission lines from Milky Way molecular clouds depend on a variety of environmental factors. In this talk, I will give an overview of the current status of the LEGO project, and then focus on our recent detailed investigation of the W49 massive star-forming region (see Figure 1). Specifically, I will present results from our study of the emissivities of many commonly observed 3mm-band molecular lines, and how they vary as a function of the environment across W49 - e.g. density and temperature (see Figure 1). A significant result I would like to discuss within this talk is the clear differentiation between emissivities of the molecular gas tracing 12CO, and the so-called "dense gas" tracers HCN and N2H+, within the observed density and temperature parameter space. This results will be placed in the context of star-forming regions within the local environment (e.g. Orion), and those within the extreme environment of the Galactic Centre. | |
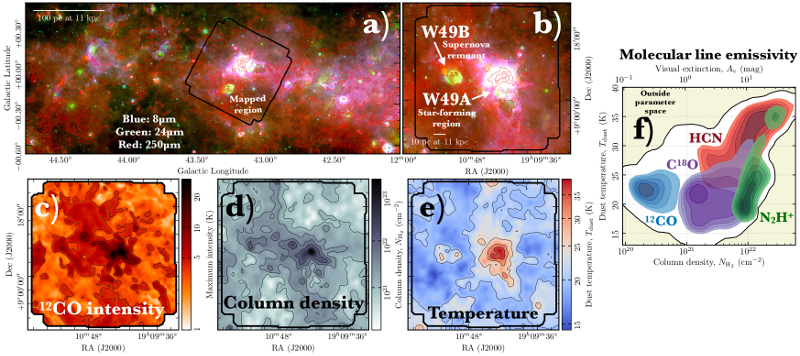 | |
| Caption: Figure 1. Example of the available data to compare to IRAM-30m LEGO observations within the mapped region, and molecular line emissivities. a) Three-colour images across the Galactic plane, and b) a zoom-in on the mapped region of W49. The black contour overlaid on all panels shows the coverage of the IRAM-30m observations. Maps of the c) 12CO maximum intensity, d) molecular hydrogen column density and e) dust temperature derived from Herschel observations. f) Example of the molecular line emissivities within the observed column density and temperature parameter space. | |
| Collaborators: J. Kauffmann, MIT, US F. Bigiel, AIfA, DE & LEGO collaboration |
Key publication
Suggested Session: Molecular Clouds |