 |

|
| EPoS Contribution |
|
High-Dimensional Identification and Statistics of Star-Forming Substructures in GMCs
Hope Chen Harvard-Smithsonian CfA, Cambridge, US | |
|
Recently, astronomers have explored various physical parameters and statistical measurements in the pursuit of understanding the structure and star formation in GMCs. However, the exploration is often limited to empirically identifying structures and correlation. Moreover, the structure identification is often done using only the (2D) information confined to the plane of the sky, while the correlation is fitted between a priori chosen physical parameters (again, often 2D). This approach not only overlooks the rich potential in the high-dimensional data, but also introduces biases due to human decision.
In the first part of this talk, I will present comparison between several structure identification algorithms including the density-based scanning (DBScan) and Dendrogram. I will present the efficiency of DBScan in identifying structures similar to the observed "bundles" in Taurus, as well as in finding potentially star forming cores, using three- or higher-dimensional data. In the second part, I will introduce statistical methods for identifying trends in high-dimensional (>3D) data, and unbiased ways for measuring the significance of correlation in the multi-dimensional parameter space. Lastly, I will showcase how these algorithms help with understanding the physical environments for substructure/star formation inside GMCs, by applying the algorithms on observational data (comprising data from the COMPLETE survey, the Herschel Gould Belt Survey, and the GBT Ammonia Survey (GAS) and simulations (mainly ENZO MHD simulations), and comparing the results in the multi-dimensional parameter space. | |
 | |
| Caption:
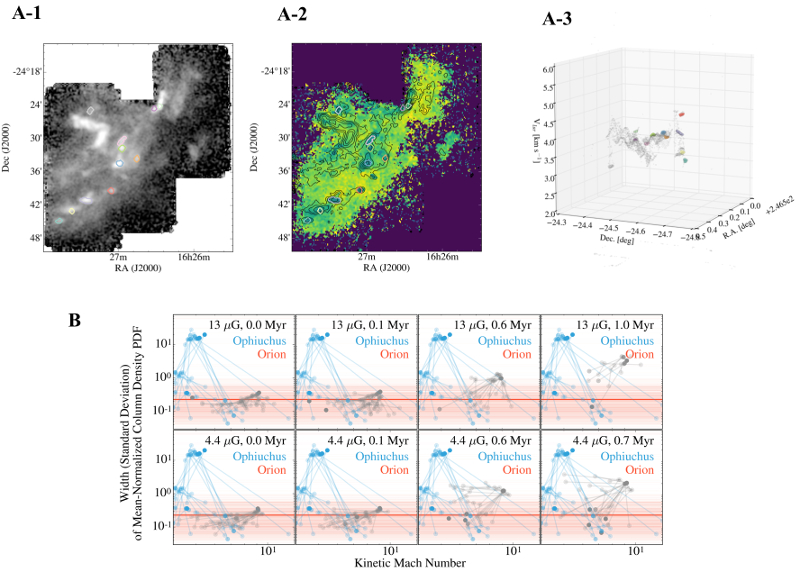
A. Identification of cores in the four-dimensional space, composed of RA, Dec, velocity, and velocity dispersion; using the NH3 emission data from the GBT Ammonia Survey (GAS), and the density based scanning (DBScan) clustering algorithm.
(A-1) The cores identified in the four-dimensional space, on the map of integrated NH3 emission. (A-2) The cores identified in the four-dimensional space, on the map of velocity dispersion, with contours showing the integrated NH3 emission. This map shows that the DBScan algorithm, applied in the four-dimensional space, successfully recognizes the "coherent cores" similar to those observed by Goodman et al. (1998) and Pineda et al. (2010), and provides a natural boundary defined by connectedness in the four-dimensional space. (A-3) The cores identified in the four-dimensional space, in the three-dimensional RA-Dec-velocity (position-position-velocity) space. The plot also shows the "noisy samples" given by the clustering algorithm. B. Comparison of GMCs in observations (Ophiuchus in blue and Orion in red) to results of simulations (ENZO MHD; in gray), in the two-dimensional space composed of the local column density PDF width and the Mach number. Each data point represents a substructure inside (observational and simulated) GMCs identified using the Dendrogram algorithm, with the lines showing hierarchy between Dendrogram-identified substructures. The top/bottom rows show MHD simulations with high/low magnetic field strengths, respectively. The evolution time of simulations increase from the left toward the right. | |
| Collaborators: A. Goodman, CfA, US J. Pineda, MPE, DE B. Burkhart, CfA, US P. Myers, CfA, US D. Collins, Florida State U, US |
Suggested Session:
Molecular Clouds |