
|
EPoS |
|
EPoS Contribution
|
|
The Barnard 5 Star-forming Core: Embedded Filaments Revealed
Jaime Pineda ESO/UK ARC Node, University of Manchester, Manchester, UK | |
| We present NH3 observations of the B5 region in Perseus obtained with the GBT and EVLA. Early EVLA observations (27 pointing mosaic) are combined with the GBT map to achieve a 6" beam. This map (~6.8'x8') covers the region of subsonic non-thermal velocity dispersion observed previously with the GBT (Pineda et al. 2010, Pineda et al. 2012). These observations reveal, for the first time, the presence of striking filamentary structure (20" wide or 5,000 AU at the distance of Perseus) in this low-mass star forming region. The integrated intensity profile of this structure is consistent with models of an isothermal filament in hydrostatic equilibrium. Also, the observed separation between the B5–IRS1 young stellar object (YSO), in the central region of the core, and the northern starless condensation matches the Jeans length of the dense gas. This suggests that the dense gas in the coherent region is fragmenting. The region observed displays a narrow velocity dispersion, where most of the gas shows evidence for subsonic turbulence, and where little spatial variations are present. It is only close to the YSO where an increase in the velocity dispersion is found, but still displaying subsonic non-thermal motions. Unfortunately, these early EVLA observations did not include NH3(2,2) and therefore no temperature information is obtained. We will also present recently obtained deeper EVLA observations of the NH3 (1,1) and (2,2) lines. The temperature map will be presented to directly test if the filament is isothermal. Also, we present observations of deuterated species which allows us to determine the variation of the amount of both deuteration radially and along the filament. We finally discuss the possibilities for further fragmentation of the filament by using higher density tracers than NH3. | |
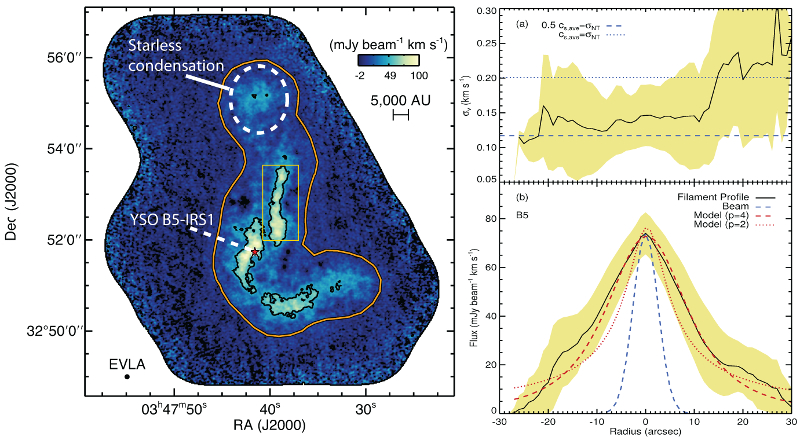 | |
| Caption: Left panel: Integrated intensity map of B5 in NH3 (1,1) obtained combining the EVLA and GBT data. Black contour shows the 50 mJy beam^-1 km s^-1 level in NH3 (1,1) integrated intensity. The orange contours show the region in the GBT data where the non-thermal velocity dispersion is subsonic. The young star, B5-IRS1, is shown by the filled star. The yellow box shows the region used in the right panel. The northern starless condensation is shown by the dashed circle. Right panel: (a) Average velocity dispersion profile perpendicular to the filament shown by the yellow box in left panel. The dispersion of the radial profile along the filament is shown by the yellow area. Blue horizontal lines show the expected velocity dispersion for two values σ_NT= 0.5 c_{s,ave} and c_{s,ave}. (b) Average integrated emission profile perpendicular to the filament, with the dispersion shown in yellow. The beam response is shown by the blue line, while two filament models are shown by the red curves. | |
| Collaborators: A.A. Goodman, HSCfA, USA H.G. Arce, Yale U, USA P. Caselli, Leeds U, UK S. Longmore, ESO, Germany S. Corder, NRAO, USA |
Key publication
|