 |

|
| EPoS Contribution |
|
Detecting Class I Protostars between 1 - 10 microns: Kicking at the Darkness
Aaron J. Maxwell University of Victoria, National Research Council of Canada - Herzberg Institute of Astrophysics, Victoria, Canada | |
| The observational picture of star formation divides the 'life' of a protostar into four main stages, from Class 0 to Class III. It is in the youngest stages, the Class 0 and Class I, that the young protostar accretes most of its mass from the dust envelope that enshrouds it. The picture of a spherical, rotating, steady state collapsing envelope is rather simplistic, as it is in these young stages that the outflows driven by protostars are the most energetic. These simple envelope models predict that the Spectral Energy Distribution of the protostellar system should resemble a 'dusty' blackbody that peaks at wavelengths longer than 10 microns; that is, there should be very little observed emission shorter than 10 microns. Recent observations of the Perseus star forming region using the Spitzer Space Telescope and the James Clerk Maxwell Telescope have revealed a small population of protostars, some with extremely red IRAC+MIPS colours that are closely associated with SCUBA 850 micron cores. This un-biased (or complete) population provides a novel opportunity to study the structure of the protostellar envelope in a statistically significant way (roughly 40 sources). The first step will be to compare the IRAC+MIPS colours to a suite of 2D radiative transfer models in order to understand what features of the protostellar envelope allow the escape of short wavelength infrared photons. Only then can it be determined what new physics or observations will be required to explain these red sources. The results of this study will further our understanding of the star formation process, particularly in the early stage when so much of what occurs in the envelope is hidden. | |
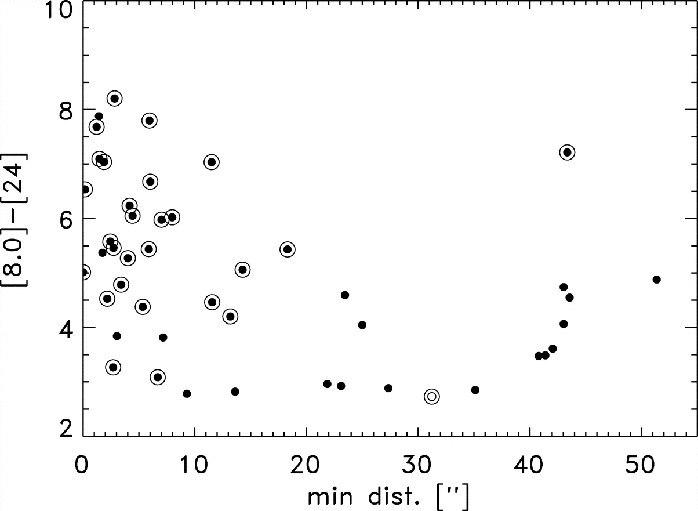 | |
| Caption: In this figure from Jorgensen et al. 2007, the protostellar source detected in the MIPS 24 micron band nearest to a molecular core detected at 850 microns by JCMT SCUBA is plotted as the IRAC+MIPS [8.0]-[24] colour against its distance to the core centre. All sources with their IRAC colour [3.6]-[4.5] > 1 have an additional circle. This figure shows that sources detected in the IRAC+MIPS bands being used for the present study tend to be located within 10" of a molecular core, and have red [3.6]-[4.5] and [8.0]-[24] colours. Many of these sources are also bluer than one would naively expect, exhibiting emission at 3.6 and 4.5 microns. | |
| Collaborators: D. Johnstone, NRC-HIA, Canada |
Key publication
Suggested Session: Cores and Collapse |