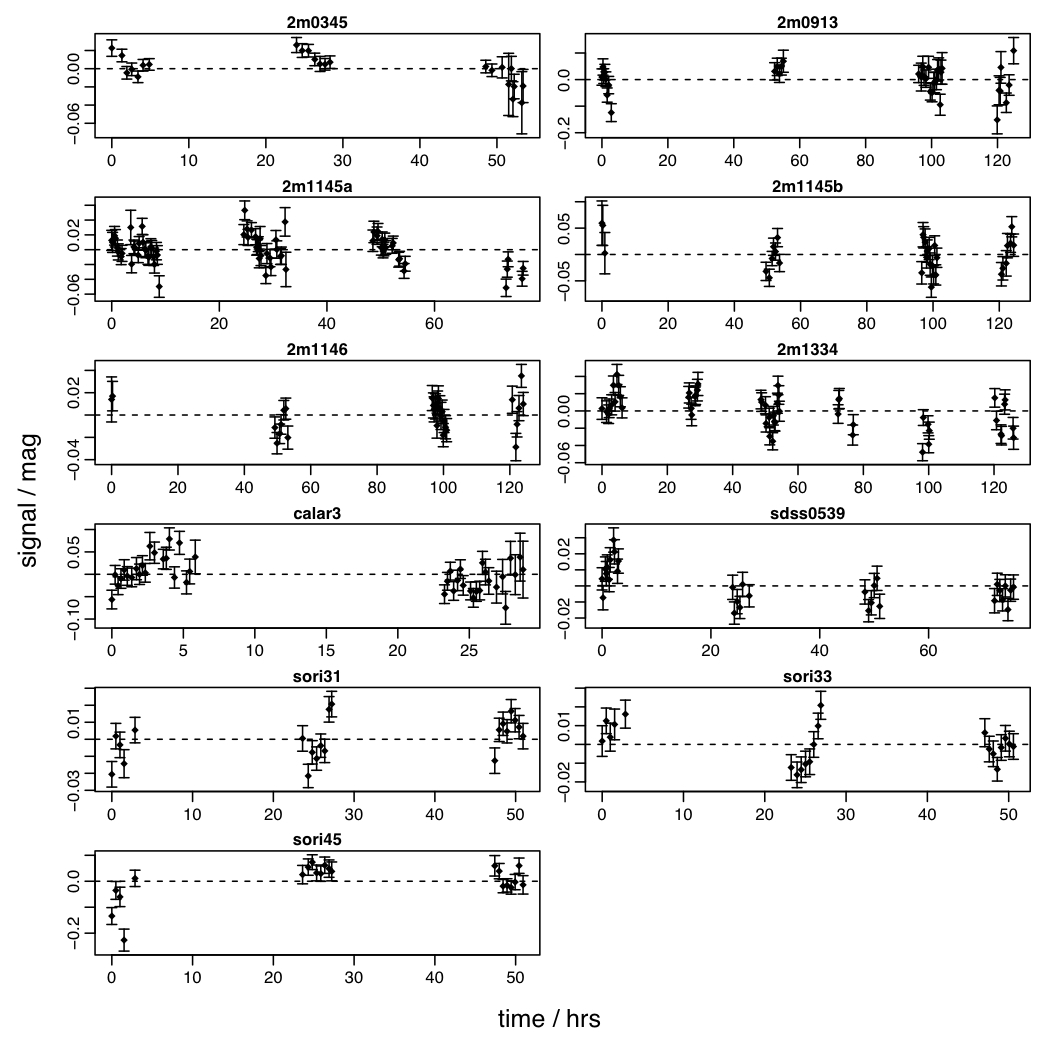
Several studies over the past 15 years have shown the light curves of brown dwarfs to be variable on time scales of hours to tens of hours. For young objects (in open clusters) this is often periodic, presumably a rotational modulation. But in older, cooler field dwarfs, the amplitudes are often much smaller, hard to detect confidently, and not obviously periodic. In this limit of low signal to noise, robust methods are essential both to make a confident variability detection and to identify the best model. Studies to date have relied too much on simple periodogram analyses which fail to consider alternative, non-periodic models. Here I reanalyse 11 light curves (Figure 1) from an earlier study (Bailer-Jones & Mundt 2001) using a more robust method of model comparison.
|
|
| Figure 1: Brown dwarf light curves (I-band), showing the variation in intrinsic brightness over time on a relative scale |
Given a light curve, the method calculates the likelihood (in the time domain) for a certain parametrized time series model. The conventional Bayesian method of model comparison is to average this likelihood over the whole parameter space of the model (more precisely, over the prior distribution of the model parameters). This average likelihood is the "evidence" for the model overall (not at specific model parameters). Contrary to what some authors use/claim, the maximum likelihood is not an appropriate measure of the overall suitability of a model, because it just favours more complex models with more parameters. However, the evidence tends to be rather sensitive to the prior adopted. I introduce instead the "cross-validation likelihood", in which the posterior-averaged likelihood for different partitions of the data are combined. This is less sensitive to the prior. For more details see Bailer-Jones 2012 and this link.
I use this method to compare, for each light curve, various deterministic and stochastic models, including a baseline model that the variations are just Gaussian fluctuations about a constant. The previous study mentioned above claimed all 11 light curves to be significantly variable according to an orthodox hypothesis test, with 2m1146, 2m1334, sdss0539, and sori31 showing periodicity. In the new analysis, all except 2m0913 are again found to be significantly variable. A sinusoidal periodic model is found to be the best model in two cases, calar3 and 2m1334, the latter however requiring an additional stochastic component for this to be true (this might reflect the need for larger uncertainties than the reported error bars). The relative probability of different model parameters for calar3 are summarized in Figure 2. One source, 2m1145a, is best described by a simple stochastic process, the Ornstein-Uhlenbeck process (a model for a damped random walk). This is consistent with a source of non-determinstic variability at work in this object's atmosphere.
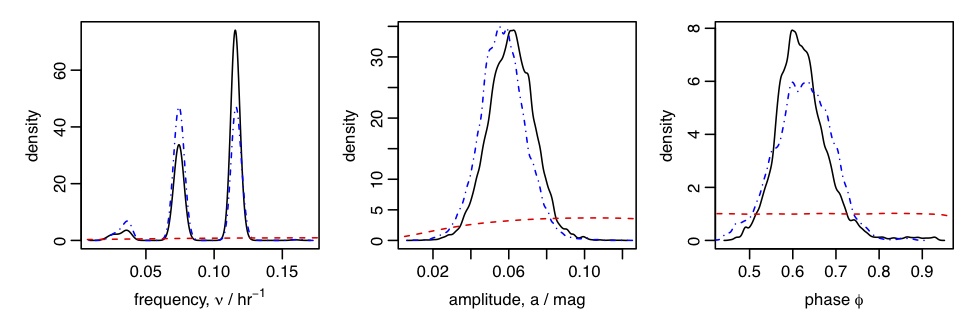 |
| Figure 2: Posterior probability density function (black/solid line for one data partition, blue/dot-dashed for another) and prior PDF (red dashed line) over the three parameters of the sinusoidal model for the light curve of calar3 |