 |

|
| EPoS Contribution |
|
Chemical and physical structures around the very low mass protostellar source IRAS 15398-3359
Yuki Okoda U Tokyo, Tokyo, JP | |
| IRAS 15398-3359 is the Class 0 protostar in the Lupus 1 molecular cloud at a distance of 155 pc. A bipolar outflow extending along the northeast-southwest axis was characterized at about a 2000 au. According to our ALMA observation, the protostellar mass is as low as 0.007 solar mass. This is based on the detection of the Keplerian motion around the protostar in the SO line. Since the envelope mass is reported to be 0.5 - 1.2 solar mass, this source should be in the very early stage of protostellar evolution. In the present study, we have studied chemical structure of this infant source in the CCH (N=4-3 and N=3-2), CS, H2CO (K=0,1,2, and 3), CH3OH, DCN, c-C3H2, and SO emissions with ALMA. To characterize the distributions of these molecular lines without any preconception, we have performed the principal component analysis (PCA) on the disk/envelope scale (Figure). The molecular lines are mainly classified by the second primary component (PC2) into two groups having the extended distribution (Group A) and the compact distribution (Group B) (Figure(g) and (i)). Group A lines mainly trace an infalling-rotating envelope extending along the northwest-southeast direction, while Group B lines a disk structure inward of the envelope. In particular, SO shows the large negative value for the PC2 axis, which represents that the SO distribution is very compact toward the protostar. This result indicates that the classification by PCA is effective to disentangle the complex molecular distributions in relation to the dynamical structures. On the other hand, the PCA can pick up the asymmetric structure of the disk/envelope system. The third primary component (PC3) has the positive peak at the eastern side of the protostar and the negative peak at the protostar position. This component represents the asymmetric distribution in the disk/envelope system. The CS and H2CO (K=0) distributions are clearly brighter in the southeastern side, and hence, the PC3 takes a positive value for them (see Figure for CS). Finally, we focus on the behavior of the H2CO lines with different upper state energies along the PC2 axis. The K=2 and 3 lines have negative values of PC2, while the K=0 and 1 lines have small positive values (Figure (i)). This means the compact distribution for the high K lines. All these results imply that PCA is effective to extract the important features of the molecular lines in protostellar cores comprehensively. | |
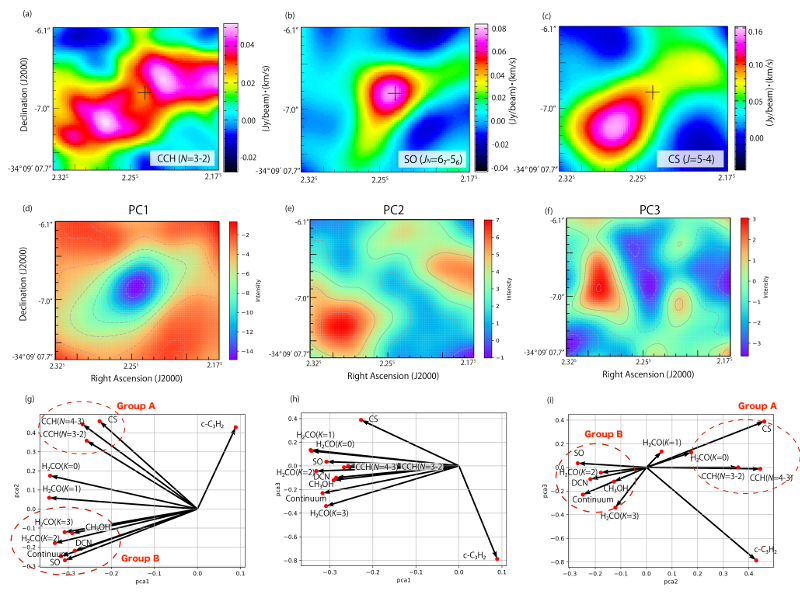 | |
| Caption: Moment 0 maps of CCH (N=3-2), SO, and CS are shown in the top raw. The cross marks show the protostellar position. The principal components PC1, PC2, and PC3 and the plot of the principal components for each distribution on the PC1-PC2, PC1-PC3, and PC2-PC3 planes are shown in the middle and bottom raw. The red dashed circles show the groups of the extended distribution (Group A) and the compact distribution (Group B). | |
| Collaborators: Y.Oya, U Tokyo, JP N.Sakai, IPCR, JP Y.Watanabe, Nihon U, JP S.Yamamoto, U Tokyo, JP |
Key publication
Suggested Session: Chemistry |