 |

|
| EPoS Contribution |
|
Gas dynamics in the star forming region G18.148-0.283
Jyotirmoy Dey IIST, Trivandrum, IN | |
| Compact HII regions are formed around massive star clusters due to the ionization of the medium surrounding them. A study of these regions in both radio/infrared continuum emission and radio recombination line (RRL) can reveal properties such as electron temperature, metallicity, density gradient (if present), kinematics of the ionized gas, etc. Here, we report the results of a study of the compact HII region G18.148-0.283 using the upgraded Giant Metrewave Radio Telescope (GMRT) at 1400 MHz. In addition to the radio continuum, we have also detected three different hydrogen recombination lines towards this star forming region using a correlator bandwidth of 100 MHz. The data of the different recombination lines have been stacked in order to improve the signal to noise ratio of the line map. Using the line and continuum data, we have generated a map of the electron temperature for the entire region. The electron temperature is found to have a peak at the central part of the region with the value decreasing towards the outer regions. The first moment map reveals a linear velocity gradient of ~12 km/s across the region, which can be interpreted as a possible signature of rotation using the position velocity (PV) diagram. G18.148-0.283 has a physical diameter of 4.9 pc and it is also a doubly peaked HII region. Using a simple model of the region with constant density, we verify that the observed rotational speed is consistent with the region being bound. It has been suggested that differential Galactic rotation can give rise to rotational kinematics similar to what we have observed in this region. I will also discuss other possible kinematic models that can explain the detected velocity structure in this source. | |
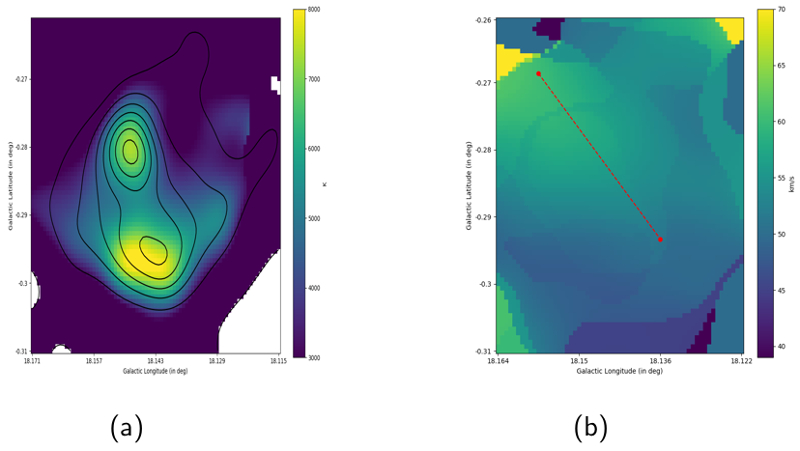 | |
| Caption: (a) The electron temperature map of G18.148-0.283 under non-LTE conditions, overlaid with the black continuum contour from the 1.44 GHz data. Contour levels are drawn ranging from 480 mJy/beam to 80 mJy/beam in steps of 80 mJy/beam (rms noise=8 mJy/beam). (b) The PV diagram of G18.148-0.283. Each pixel of the RRL image cube is fitted with a Gaussian profile. The map shows the distribution of the central velocity extracted from the fit across the region. The dotted red line is the direction of the linear velocity gradient detected. | |
| Collaborators: J.D. Pandian, IIST, IN D.V. Laal, NCRA-TIFR, IN |
Suggested Session:
High-Mass Star Formation |