 |

|
| EPoS Contribution |
|
The new Solar neighborhood: gas mass distribution and dynamics
Joao Alves U Vienna, Vienna, AT | |
| For the past 150 years, the prevailing view of the local ISM was based on a peculiarity known as the Gould's Belt, an expanding ring of young stars, gas, and dust, tilted about 20° to the Galactic plane. Still, the physical relation between local gas clouds has remained practically unknown because the distance accuracy to clouds is of the same order or larger than their sizes. With the advent of large photometric surveys and the Gaia satellite astrometric survey, this situation has changed. Here we report the 3-D structure of all local cloud complexes. We find a narrow and coherent 2.7 kpc arrangement of dense gas in the Solar neighborhood that contains many of the clouds thought to be associated with the Gould Belt. This finding is inconsistent with the notion that these clouds are part of a ring, disputing the Gould Belt model. The new structure comprises the majority of nearby star-forming regions, has an aspect ratio of about 1:20, and contains about 3 million solar masses of gas. Remarkably, the new structure appears to be undulating and its 3-D distribution is well described by a damped sinusoidal wave on the plane of the Milky Way, with an average period of about 2 kpc and a maximum amplitude of about 160 pc. Our results represent a first step in the revision of the local gas distribution and Galactic structure and offer a new, broader context to studies on the transformation of molecular gas into stars. In this contribution, we will also present preliminary results on the dynamical state of this structure as well as its dust properties. | |
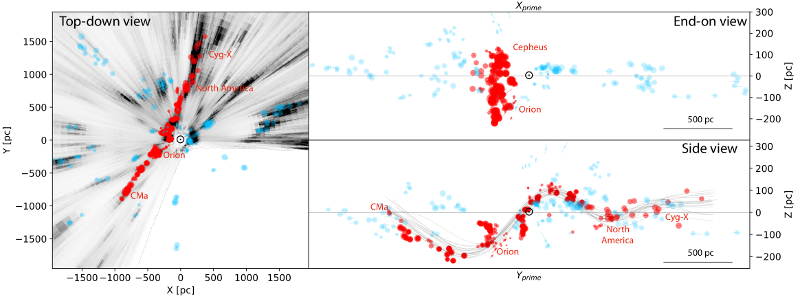 | |
| Caption: 3-D distribution of local molecular clouds. The position of the Sun is marked with a ⊙. The red points were selected by a fitting algorithm and describe a spatially and kinematically coherent structure almost 3 kpc long. The grayscale on the XY panel shows an independent integrated dust map (from Green et al. 2009, -300 < Z < 300 pc), that indicates that our sample of clouds distances is essentially complete. The 1σ statistical uncertainties (usually 1-2% in distance) are represented by line segments, which are usually smaller than the symbols. For an interactive version of this figure, including extra layers not shown here (e.g. model of the Gould's Belt, log-spiral arm fits, and more) go here. | |
| Collaborators: C. Zucker, Harvard, US A.A. Goodman, Harvard, US J.S. Speagle, Harvard, US S. Meingast, U Vienna T. Robitaille, Aperio software, UK D.P. Finkbeiner, Harvard, US E.F. Schlafly, LBNL, US G.M. Green, MPIA, DE |
Key publication
Suggested Session: Molecular Clouds |