 |

|
| EPoS Contribution |
|
Young Stellar Population in the W3: AFGL333, W3 south, and a cometary BRC
Serena Kim Steward Observatory, Tucson, US | |
| We present our observational studies on star formation associated with the AFGL333 complex and its surrounding including the bright-rimmed cloud (BRC) 5 and W3-south cluster in the high density layer (HDL) region located in between the W3 giant molecular cloud and W4 H II region. This region is suggested to be experiencing triggered/assisted mode of star formation. We have conducted a multi-wavelength study of the region using optical, near- and mid-IR data. Using Spitzer data and from our deep near-IR observations we identified and classified young stellar objects. We present results on census of young stellar population, extinction map, stellar density, and spatial distribution of the young stars in the region. We find about 580 YSOs associated with AFGL333. The ages of YSO candidates range between 0.1-5 Myr with wide age spread. Spatial distribution of class I and class II sources suggests that the IR dark cloud (IRDC) region in AFGL333 harbors more class I sources than its surrounding area, suggesting relatively younger YSO population | |
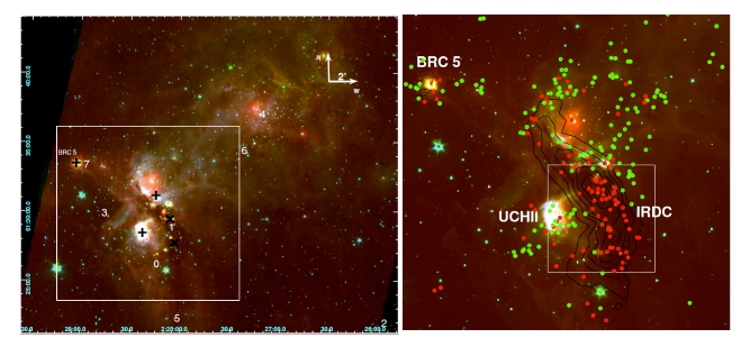 | |
| Caption: LEFT: A color composite image of the 20’x20’ area around AFGL 333 complex and surrounding area (centered at RA (2000.0) = 02:27:2.7, DEC(2000.0) = +61:33:30") using Spitzer data (blue: 3.6 um; green: 4.5um; red: 24.0 um). The + symbols represent the IRAS sources (top left: IRAS 02252+6120, middle: IRAC 02244+6117, bottom: IRAS02245+6115), X symbols represent the massive molecular clumps (top: clump A, bottom: clump B) identified by Sakai et al. (2005) and the numbers (0 to 7) correspond to the locations of the various sub-groups identified in the complex based on the stellar density and age sequence by Rivera-Ingraham et al. (2011); RIGHT: The white colored boxed region in the left panel (AFGL333) is shown more in detail on the right. Spatial distribution of Class I and II YSO candidates are overlaid on the color composite image made of K-band (blue) from NEWFIRM, 4.5um (green) and 24.0 um (red) images from Spitzer. Class I and II sources are represented in red and green, respectively. The locations of few sub-regions are marked along with the 1.1mm emission map from BOLOCAM survey (black contours). The small box indicate the area in the dark cloud with high density of Class I sources. | |
| Collaborators: J. Jose, IIA, India W.H. Sherry, Eureka Scientific, USA M.R. Meyer, ETH Zuerich, Switzerland |
Suggested Session:
Massive Star Formation and Feedback |