Variability and rotation of ultra cool
dwarfs
Over the past few years monitoring programs have shown ultra cool
dwarfs (UCDs) to be photometrically variable. Of the 60 sources
monitored in the field and some 120 monitored in clusters, about 40%
show variability in both cases. For mid to late M dwarfs in young
(<100 Myr) clusters, this variability is generally periodic with
amplitudes of up to a few tenths of a magnitude and periods of between a
few hours and several days. For older field dwarfs (covering late
M, L and T types) this variability is often nonperiodic with smaller
amplitudes (up to 0.1 mag in I) and timescales of order hours. The
former may be attributed to the rotational modulation of
magnetically-induced photospheric spots, as seen in higher mass T Tauri
stars. The nonperiodic variability, on the other hand, may be caused by
a rapid evolution of surface features (which 'mask' the otherwise
observable rotational modulation). This could be related to the
formation and dissipation of inhomogeneities in dust clouds in the
photospheres of UCDs.
Work over the past few years by several groups has shown strong
evidence for low amplitude photometric variability in both field and
cluster very low mass stars and brown dwarfs (collectively, ultra cool dwarfs, or UCDs). An
example light curve and power spectrum is shown below.
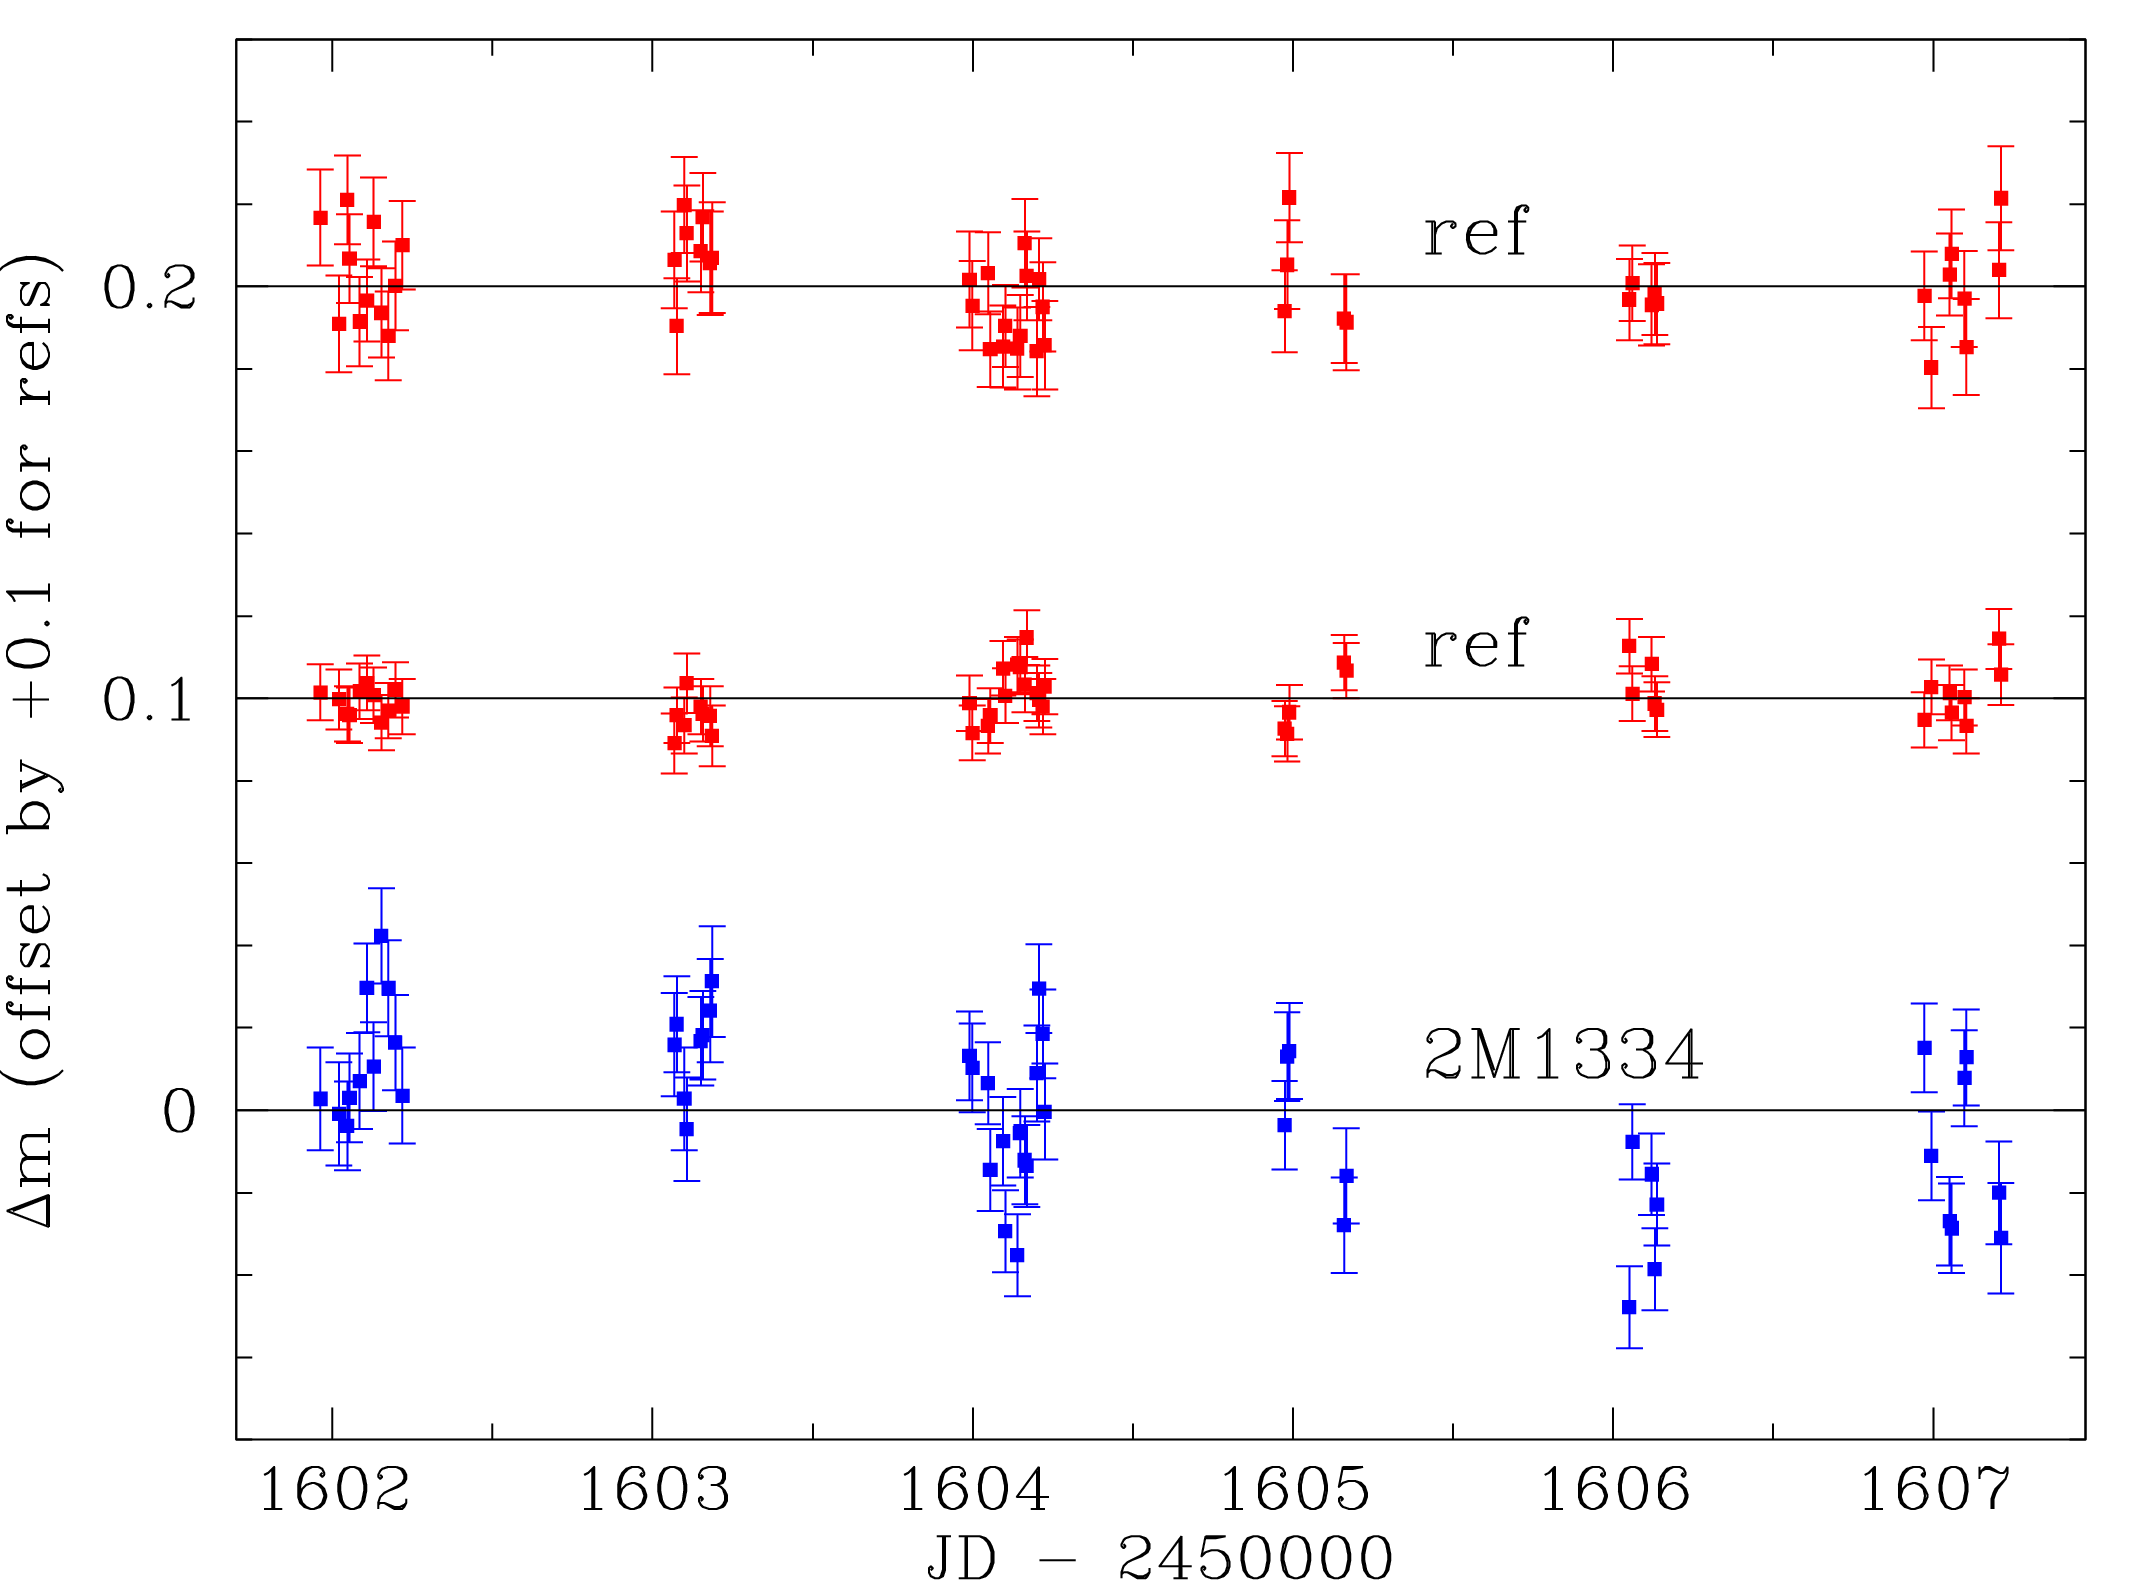
Figure: The differential light curve
of a field L dwarf (bottom) and
two (of many) reference stars (top two)
For the field UCDs, variability
timescales are typically of order a few hours with amplitudes of between
0.01 and 0.08 mags in the I band. In several cases, the variability in
UCDs has been found to be non-periodic. This is curious, as in
many cases the monitoring surveys would have been sensitive to expected
UCD rotation periods We have interpreted this with a masking hypothesis: If surface
evolve on a timescale shorter than the rotation period, these will
obscure a regular modulation of the light curve.
There are at least two plausible candidates for causing the
variability. The first is cool, magnetically-induced spots.
This is an attractive explanation for cluster UCDs: as these are young,
they may show activity with spots appearing in analogy to weak-lined T
Tauri stars. However, there are theoretical arguments against the
presence of spots at these very low temperatures because of the
neutrality of the photosphere and thus a weak coupling between the gas
and any magnetic field. A second explanation is dust clouds. Dust is
known to form at these low temperatures. Rapid rotation and convection
could give rise to complex atmospheric dynamics, possibly accounting for
the non-periodic variability seen in field L and T dwarfs. I have made
initial attempts to predict and observe the spectroscopic signatures of
different types of spot and cloud patterns, shown below.

Figure (above): Model DUSTY (red/thick) and COND (blue/thin) spectra
from Allard et al. (2001) for a
UCD with Teff=1900 K.
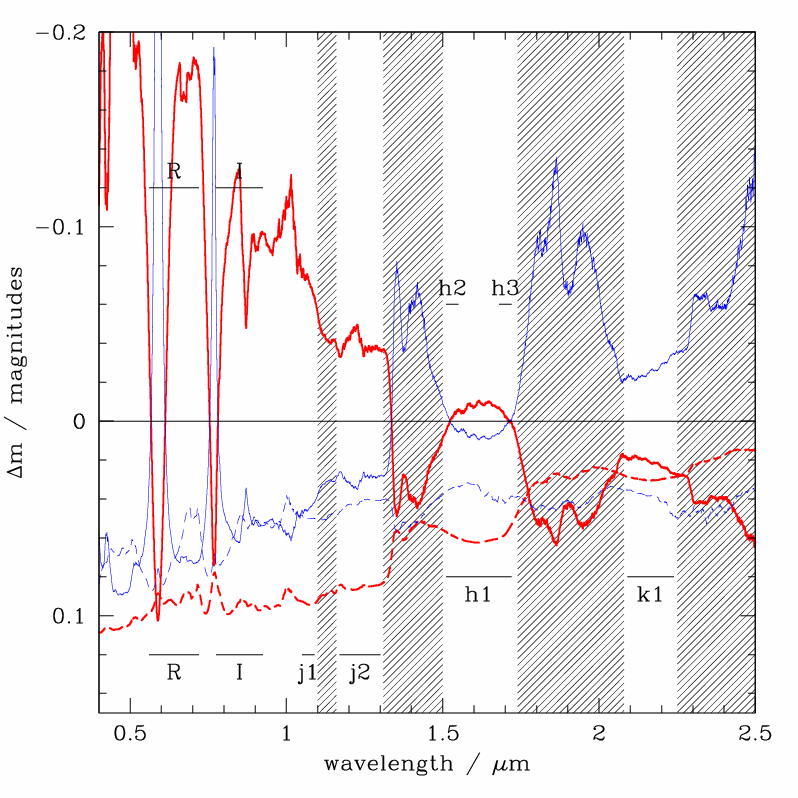
Figure: Predictions of the change in the spectrum of a UCD due to the formation of a cloud or spot with a
10% filling fraction. The four lines shown are for: COND cloud on a DUSTY atmosphere (thick/red solid line)
and 200 K cooler spot on a
DUSTY atmosphere (thick/red dashed line); DUSTY cloud on a COND atmosphere (thin/blue solid line) and 200
K cooler spot on a COND
atmosphere (thin/blue dashed line).
To test these predictions, I obtained time-resolved differential
spectrophotometric observations of one field L1.5 dwarf. Spectra were
obtained relative to a reference star observed simultaneously in the
slit. There is no strong evidence for variability in any single band, but there is evidence
for colour-correlated variability. Adopting a dusty atmosphere
with Teff=1900 K this limits coherent clear clouds to a coverage of no
more than 10-15% and 200 K cooler spots to a 20% coverage.
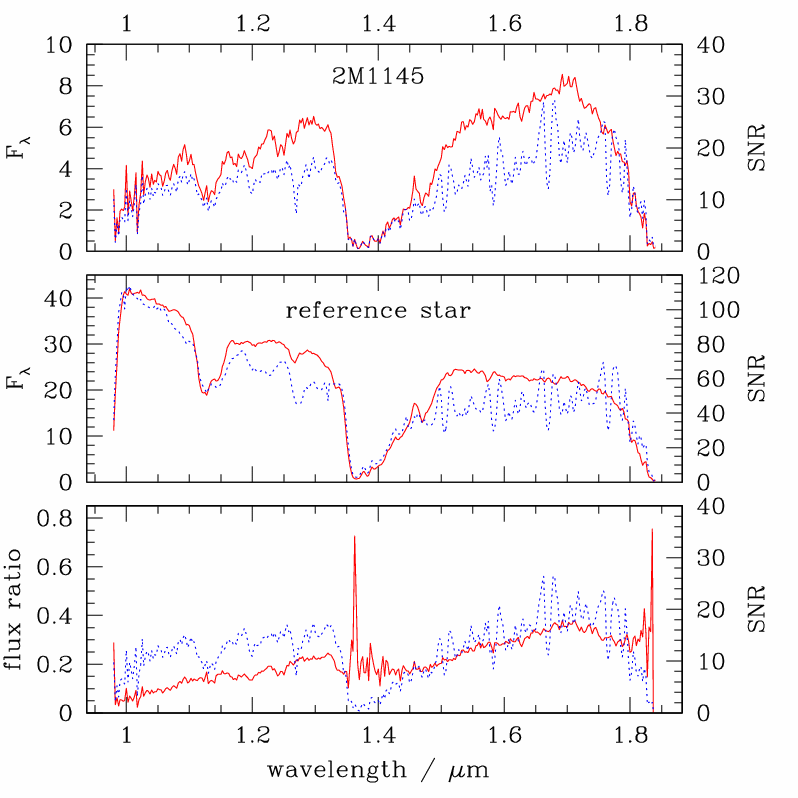
Figure: Near infrared spectra of the L1.5 dwarf 2M1145 (top), the
reference star observed in the
same slit (middle) and their relative spectra (bottom) used to monitor for variability
independent of changes in the Earth's atmosphere. The red (solid) lines
show the flux (left scale) and the blue (dashed) lines the SNR (right scale).
This work is discussed in a number of articles (from oldest to newest):
Coryn Bailer-Jones, calj at mpia-hd.mpg.de
Last modified: 21 November 2012